
PC problems · Storage and memory
What is using my RAM? How to find it on Windows 11
The biggest memory user on my PC isn't a game, it's a local AI model at up to 7.8 GB. How to find what is using your RAM on Windows 11, what the numbers in Task Manager mean, and how RigSight spots an app that keeps growing.
The short answer
Open Task Manager with Ctrl + Shift + Esc, go to Processes and click the Memory column to put the biggest users on top. If the total is high but the list looks small, check Performance > Memory. Cached and compressed memory are normal, and memory that keeps growing for hours points to a leak.
When I sorted RigSight's history by memory, the biggest user on my PC wasn't a game. It was Llama Server, a local AI model I run, at up to 7.8 GB. The heaviest game came next, Phantom Blade Zero at up to 6.9 GB, then Apex Legends at 6.6 GB. Task Manager would only have shown me whichever was open at that moment. Here is how to find out what is using your RAM on Windows 11, which numbers are normal, and what to do when one app keeps taking more.
How RigSight caught it
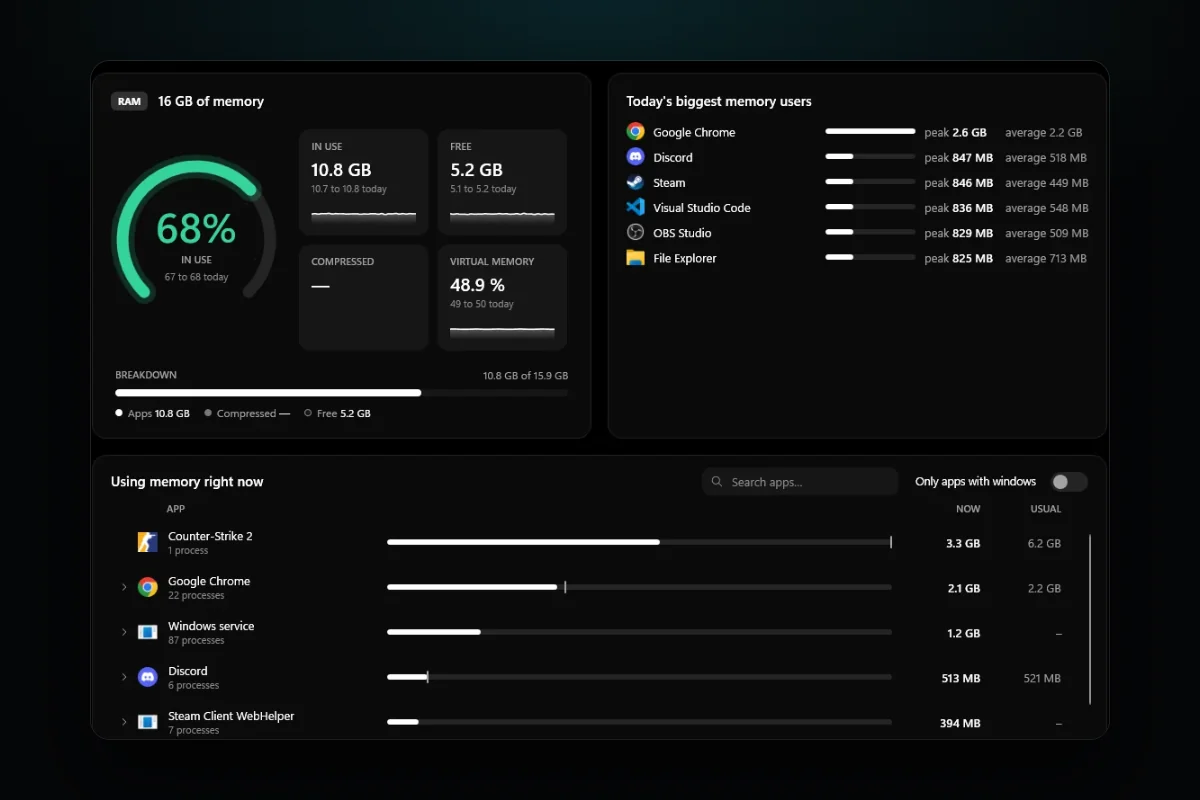
Task Manager shows what is using memory right now. It doesn't tell you whether an app always uses that much, or only started today. RigSight keeps a record of each app's memory all day, so it can.
The Memory page shows how full your RAM is, with today's lowest and highest, and splits it into apps, compressed and free. Below that, every running app is listed with what it holds now beside its usual, which is its average over the days before today. An app well above its usual is marked, such as "Twice its usual", and a Worth a look card points it out. When nothing is above its usual, the page shows the apps holding the most instead. Today's biggest memory users lists each app's peak and average, and a card shows when memory was fullest today and which apps held the most around then.
Since version 1.7.0, RigSight can also tell you about a leak while it happens. Turn on Apps that keep growing in memory in Settings, and when an app's memory has risen every hour for three hours, ending at 2 GB or more and at least twice where it started, you get a notification such as "Google Chrome keeps using more memory". It says how far it went and how fast, and that it hasn't come back down. The bell in the title bar keeps it for 30 days.
On the Processes page, open a browser or another app made of many processes, and RigSight splits its memory into its tabs, its extensions and the app itself, with its recorded history beside it. You can end an app there too, with a warning before you end a part of Windows. RigSight is free and open source.
What is using my RAM on Windows 11? Check Task Manager
- Press Ctrl + Shift + Esc to open Task Manager.
- Pick Processes on the left.
- Click the Memory column header. The apps holding the most memory move to the top.
- Click the arrow next to an app to see the separate processes inside it.
Browsers, Discord, Steam and many other apps run as several processes, so one name can hide twenty of them. The list is split into apps, background processes and Windows processes. Lines called Service Host are parts of Windows, grouped by the service they run.
If one app is clearly holding the most, you have your answer. Close it, or close the tabs or projects inside it you don't need. If nothing in the list looks big but the total is still high, read on.
Why the total is higher than the list adds up to
The Processes list only counts memory that apps hold. Windows also uses RAM for itself, for drivers and as a cache. To see all of it, open Performance in Task Manager and pick Memory. The figures under the graph mean the following.
- In use is memory that apps and Windows hold right now. The number next to it in brackets is the compressed part.
- Compressed memory is memory apps aren't touching at the moment, squeezed by Windows so more fits in RAM. It is faster than writing it out to the drive, and it is normal to see a few hundred MB or more.
- Cached is files and programs Windows keeps in RAM in case you open them again. Windows hands this memory to any app that asks for it, so a big cache is a good thing.
- Available is what apps can still get, which is free memory plus the cache that can be given back.
- Committed is memory promised to apps, counted against your RAM and the page file together. When it gets close to the limit, Windows warns that the PC is low on memory.
- Non-paged pool is memory the Windows kernel and drivers use. It should stay fairly steady.
- Hardware reserved is set aside before Windows starts, for example for integrated graphics.
The figure to watch is Available. Plenty available means you have room, even if In use looks high.
Get a clearer split with Resource Monitor
- Press Start, type resmon and open Resource Monitor.
- Pick the Memory tab.
- Click the Private (KB) column to sort by it.
Private memory belongs to that process alone, so it is the best single figure for which app is holding your RAM. The bar at the bottom splits all memory into Hardware Reserved, In Use, Modified, Standby and Free. Standby is the same cache Task Manager calls Cached. Modified is memory waiting to be written to the drive before it can be reused, and it is usually small.
High memory usage on Windows 11 with nothing running
When you haven't opened anything and memory is still high, it is usually one of these.
Apps that start with Windows
Game launchers, chat apps, RGB and peripheral software, cloud sync and updaters all load at sign-in and sit in the tray. Open Task Manager, pick Startup apps, right-click anything you don't need right away and choose Disable. It still works when you open it yourself.
A browser that never closed
Chrome and Edge can keep running in the background after you close the last window, so extensions and apps can keep working. Turn that off in the browser's settings if you don't want it. In Chrome it is under Settings > System, in Edge under Settings > System and performance.
The cache after a game
After a big game, Cached can stay high for a while. That is Windows keeping files ready, not memory being lost. You don't need a RAM cleaner app to clear it. Those tools empty the cache, and Windows fills it again.
Work after an update
After a large Windows update, Windows often reindexes files and does other background work for a while. Restart and give it a few hours before you chase it.
A memory leak
If one app grows hour after hour while you do nothing more in it, it is leaking. Restart that app to get the memory back, then update it. If it keeps happening, the app's own support page or forum usually knows about it.
High memory usage not showing in Task Manager
If Performance > Memory says most of your RAM is in use but the Processes list adds up to far less, look at the Non-paged pool figure. If it keeps climbing over hours and reaches several GB, a driver is probably leaking memory. Drivers you installed or updated recently are the first suspects. Update or reinstall them, and restart.
To see exactly where memory has gone, Microsoft's free Sysinternals tool RAMMap splits all of it by use, including driver memory, the cache and each process. It needs to run as administrator.
Browser tabs and Chrome's high memory usage
Each tab and extension in Chrome or Edge is its own process, which is why a browser so often tops the list. Two settings help.
- In Chrome, open Settings > Performance and turn on Memory Saver. Tabs you haven't used for a while are put to rest and reload when you go back to them.
- In Edge, open Settings > System and performance and turn on sleeping tabs, which does the same.
To find the one heavy tab, press Shift + Esc inside Chrome or Edge. The browser's own task manager lists every tab and extension with its memory.
When high memory use is a real problem
High In use on its own is fine. It is a problem when Available is close to zero, the drive light stays busy while apps stutter, or Windows tells you the PC is low on memory. Then the fix is to run less at once, find the leaking app, or add RAM. Windows 11 needs at least 4 GB to run, and games and browsers with many tabs need a lot more than that. Leave the page file on and let Windows manage its size. Without it, apps can close without warning when memory runs out.
Start with Task Manager's Memory column and the Available figure. If nothing stands out, check Startup apps and your browser's settings. If something keeps growing, restart it and update it, and if the Non-paged pool is the one growing, update your drivers next.
Questions people ask
Why is my memory usage high on Windows 11 with nothing running?
Usually it's apps that start with Windows and sit in the tray, a browser that keeps running after you close its window, and memory Windows keeps as a cache. Cached memory is handed back as soon as an app needs it, so it isn't a problem. Check Task Manager's Startup apps page and turn off what you don't need.
Why is high memory usage not showing in Task Manager's list?
The Processes list only shows what apps hold. Memory used by drivers, the Windows kernel and hardware such as integrated graphics isn't listed there. If the Non-paged pool figure on Performance > Memory keeps climbing for hours, a driver may be leaking memory, and Microsoft's free RAMMap tool shows where it went.
Is high memory usage at idle bad?
Not by itself. Windows uses spare RAM to cache files you might open again, and gives it back the moment an app asks. It's a problem when Available memory is close to zero, the PC stutters or Windows warns that it is low on memory.
Why does Chrome use so much RAM?
Chrome runs each tab and extension as its own process, so its memory adds up quickly with many tabs open. Turn on Memory Saver in Settings > Performance, and press Shift + Esc in Chrome to open its own task manager and see which tab or extension holds the most.
Why is my memory usage high after a Windows update?
Right after a big update Windows often does background work, such as indexing files again. Give it a few hours and a restart before you go looking. If one process still holds far more than it used to, update or reinstall that app or driver.