
Building RigSight
Three ways my temperature chart was lying
Peaks that moved every second, a 74° high that never showed on the line, and a gap that looked exactly like a cool PC.
The short version
Three ways a temperature chart drawn from real numbers still misled people. Peaks shifted as it moved, averages hid the high, and missing time looked exactly like a calm PC.
The temperature chart is the most looked-at thing in RigSight. It's also the one I thought was done. Then, in the first week of October, I found it was misleading people in three different ways.
Peaks that moved every second
A user on a laptop wrote that on the one hour view, the peaks seemed to jump around every second. A spike would be in one place, then a bit to the left, then a different height.
A chart an hour wide has more readings than it has pixels, so readings get grouped. Mine grouped them by where they landed on the screen. Every second the chart slid along by a little, the groups changed, and a reading that jumped around a lot, as laptop CPU temperatures do, landed in a different group and changed the line's shape.
Version 0.16.1 groups readings by the clock instead, with one point for each minute, the same minute every time. The chart still moves along, but a minute that already happened keeps the shape it had.
A 74° high that the line never showed
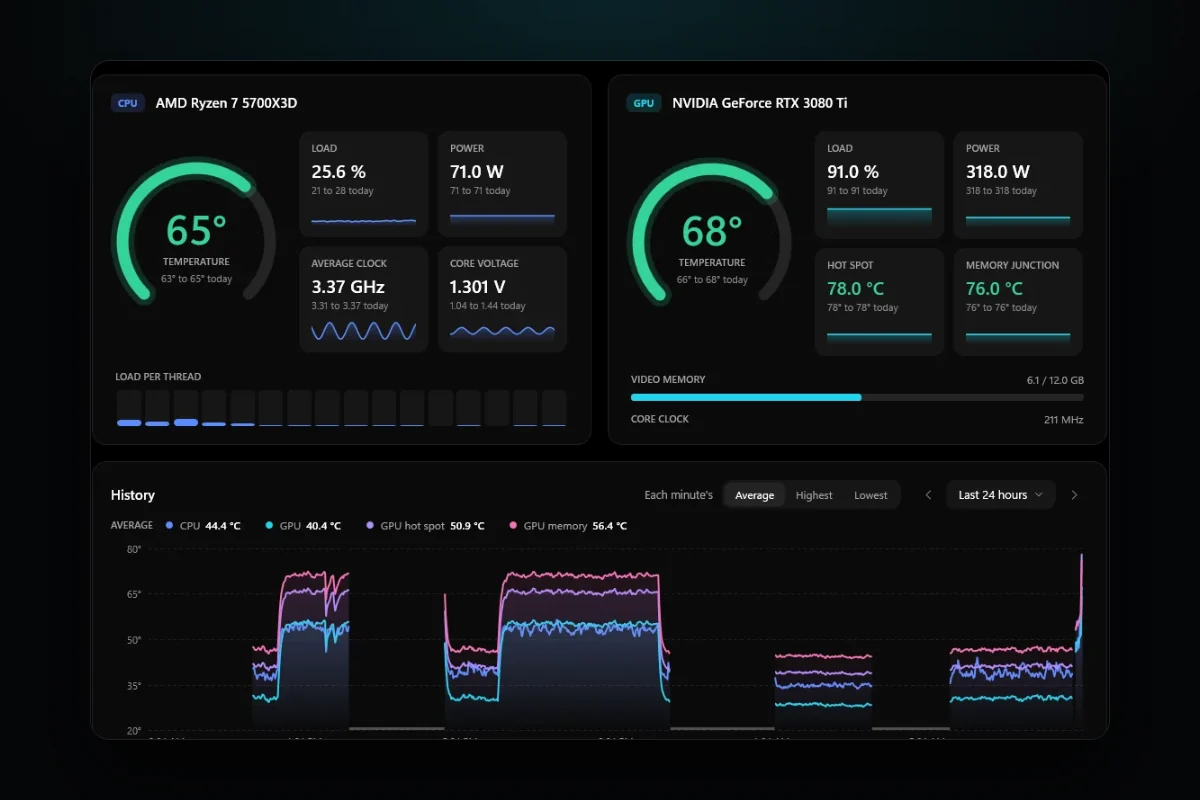
The next one was a mismatch between two numbers on the same page. A day's highest GPU temperature was 74°, but the line on the chart topped out at 68°. Both were right. The line showed each minute's average, and inside one minute the GPU had touched 74 for a few seconds.
That's confusing if you're looking for the moment it got hot. So from 0.18.0 the chart has a switch for each minute's average, its highest or its lowest. Hovering a minute shows all three. I kept the average as the default because it shows the trend, and the highest is one click away when you're hunting a spike.
A gap that looked like a cool PC
The third came from someone on X. They pointed out that a gap in the chart, time when RigSight recorded nothing, looked exactly the same as a PC that had stayed cool.
They were right. A gap and a quiet PC looked identical. Since 0.18.0, any stretch with nothing recorded is shaded and labelled "Not recorded". Hovering it gives the times and, when Windows' own log says, the reason. The PC was off, or asleep, or it started up again.
What I check now
All three charts were drawn from correct numbers. Each one still told people something untrue. So now, when I change a chart, I ask three questions.
- Does a point keep its shape while the chart moves?
- Can the highest reading of the period be found on the chart?
- Can you tell missing time from calm time?
The same goes for the pictures on this website. A spiky chart full of gaps looks broken, even when it's honest, so the pictures on the site use a stretch of time where the test PC was on the whole way through.