
Building RigSight
Two numbers from my own PC that couldn't be true
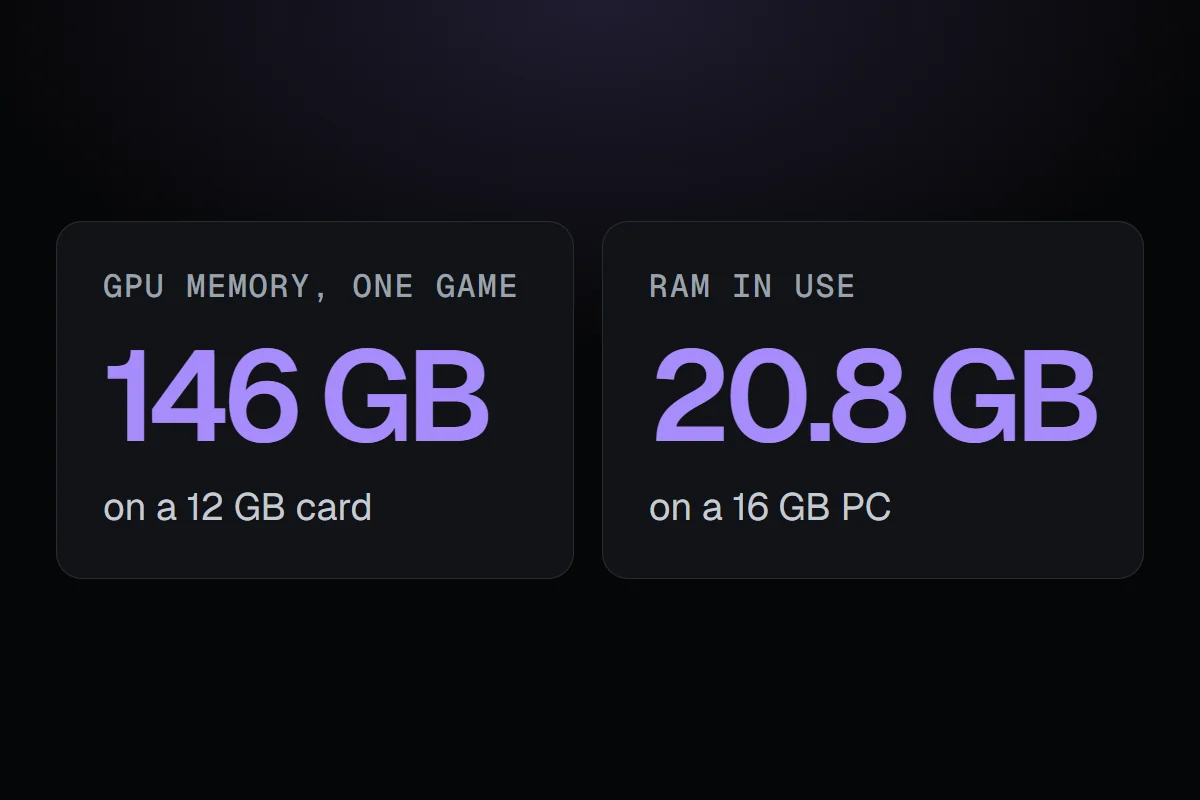
Writing these guides from my own history, I found a game using 146 GB of a 12 GB GPU and a 16 GB PC using 20.8 GB of RAM. Neither was real. Where each came from, and what 1.10.0 changed.
The short version
Writing guides from my own history turned up two impossible readings. Crimson Desert showed 146 GB of GPU memory on a 12 GB card, because Windows' per-app figure isn't held to the card's size. And my first day of history had RAM at 20.8 GB on a 16 GB PC, read from virtual memory. 1.10.0 handles both.
Most of the guides on this blog open with my own PC's history. To write one, I query what RigSight recorded, then check every number before it goes in. Twice in the last two weeks, a number failed that check because it couldn't be true.
146 GB on a 12 GB card
On 7 November I was writing how to check VRAM usage, and I wanted how much graphics memory each of my games used. Since 0.31.2, RigSight records the game in front's own GPU memory each minute, next to the whole card's. Phantom Blade Zero came back at up to 7.2 GB, which fits a 12 GB RTX 3080 Ti. Crimson Desert came back at about 146 GB.
The whole card was at 7.3 GB in those same minutes, on 28 and 30 October. The game's own figure comes from Windows, the same per-app number Task Manager shows as Dedicated GPU memory. Windows doesn't hold that number to the card's size. It can count memory the game refers to without it all being on the card. For most games it stays sensible. For this one, on those days, it didn't.
The Games page was showing it as is. So were the export and the AI's look-ups, since they all read the same play figures. In 1.10.0, a play where the game's own figure goes above the whole card even once isn't trusted for that play. It shows the card's figure instead, said as the whole GPU and all apps, the same way it does when Windows doesn't report a game's own use at all. The change is in how plays are read, not in what's stored, so plays from before the fix are covered too.
20.8 GB of RAM on a 16 GB PC
On 10 November I was writing what is using my RAM. My PC has 16 GB, and RigSight's own list of my parts says so. Its history said the highest RAM in use was 20.8 GB.
The 142 minutes above 16 GB were all on 23 September, the first day RigSight ever recorded on this PC. The hardware library RigSight reads sensors through names the RAM group and the virtual memory group the same way, both "Memory". Virtual memory is RAM plus the page file, so it can go well past 16. A build from that first day sometimes read the wrong group. I fixed that the same day, before 0.4.0, but those minutes stayed in my history for seven weeks.
On 11 November I blanked the 213 minutes of RAM readings from that first day, after a backup. Nothing else in those minutes changed. 1.10.0 then fixed the cause of the confusion for everyone. Virtual memory's readings now have names of their own, Virtual Memory, Virtual Memory Used and Virtual Memory Available, so the taskbar, the overlay, the widget pickers and All sensors no longer show two readings called Memory. Names you gave readings yourself keep working.
Today the highest RAM in my history is 15.7 GB, on a 16 GB PC. That's the number the normal RAM usage while gaming guide uses.
Why the guides are worth checking this hard
Both readings sat in my own history for weeks, and I look at RigSight every day. A number on a page gets a glance. A number I'm about to publish gets questioned, because someone else will read it and maybe act on it. Writing from my own data has turned out to be one of the better tests RigSight has.
It's also why the guides say what they don't know. When a reading looks wrong and I can't explain it, it stays out of the post until I can.